I recently read Joe Onisick’s piece, “Have We Taken Data Redundancy Too Far?â€Â I think Joe raises a good point, and this is a natural topic to dissect in detail after my previous article about cloud disaster recovery and business continuity. I, too, am concerned by the variety of data redundancy architectures used in enterprise deployments and the duplication of redundancy on top of redundancy that often results. In a series of articles beginning here, I will focus on architectural specifics of how data is stored, the performance implications of different storage techniques, and likely consequences to data availability and risk of data loss.
The first technology that comes to mind for most people when thinking of data redundancy is RAID, which stands for Redundant Array of Independent Drives. There are a number of different RAID technologies, but here I will discuss just a few. The first is mirroring, or RAID-1, which is generally employed with pairs of drives. Each drive in a RAID-1 set contains the exact same information. Mirroring generally provides double the random access read performance of a single disk, while providing approximately the same sequential read performance and write performance. The resulting disk capacity is the capacity of a single drive. In other words, half the disk capacity is sacrificed.
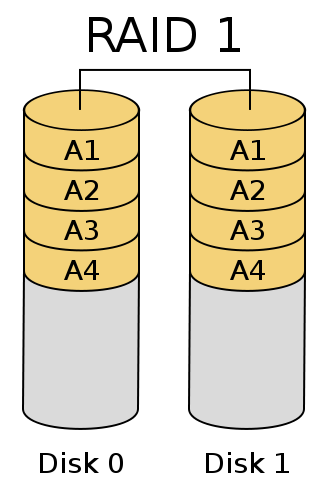
Courtesy Colin M. L. Burnett
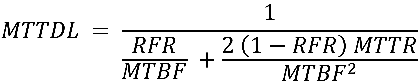
A useful figure of merit for data redundancy architectures is MTTDL, or Mean Time To Data Loss, which can be calculated for a given storage technology using the underlying MTBF, Mean Time Between Failures, and MTTR, Mean Time To Repair/Restore redundancy. All “mean time†metrics really specify an average rate over an operating lifetime; in other words, if the MTTDL of an architecture is 20 years, there is a 1/20 = approximately 5% chance in any given year of suffering data loss. Similarly, MTBF specifies the rate of underlying failures.  MTTDL includes only failures in the storage architecture itself, and not the risk of a user or application corrupting data.
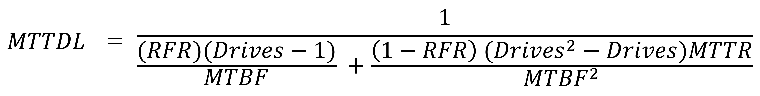
For a two-drive mirror set, the classical calculation is:
![]()
This is a common reason to have hot-spares in drive arrays; allowing an automatic rebuild significantly reduces MTTR, which would appear to also significantly increase MTTDL. However…
While hard drive manufacturers claim very large MTBFs, studies such as this one have consistently found numbers closer to 100,000 hours. If recovery/rebuilding the array takes 12 hours, the MTTDL would be very large, implying an annual risk of data loss of less than 1 in 95,000. Things don’t work this well in the real world, for two primary reasons:
- The optimistic assumption that the risk of drive failure for two drives in an array is uncorrelated. Because disks in an array were likely sourced at the same time and have experienced similar loading, vibration, and temperature over their working life, they are more likely to fail at the same time. Also, some failure modes have a risk of simultaneously eliminating both disks, such as a facility fire or a hardware failure in the enclosure or disk controller operating the disks.
- It is also assumed that the repair will successfully restore redundancy if a further drive failure doesn’t occur. Unfortunately, a mistake may happen if personnel are involved in the rebuild.  Also, the still-functioning drive is under heavy load during recovery and may experience an increased risk of failure. But perhaps the most important factor is that as capacities have increased, the Unrecoverable Read Error rate, or URE, has become significant. Even without a failure of the drive mechanism, drives will permanently lose blocks of data at this specified (very low) rate, which generally varies between 1 error per 1014 bits read for low-end SATA drives to 1 per 1016 for enterprise drives. Assuming that the drives in the mirror are 2 TB low-end SATA drives, and there is no risk of a rebuild failure other than by unrecoverable read errors, the rebuild failure rate is 17%.
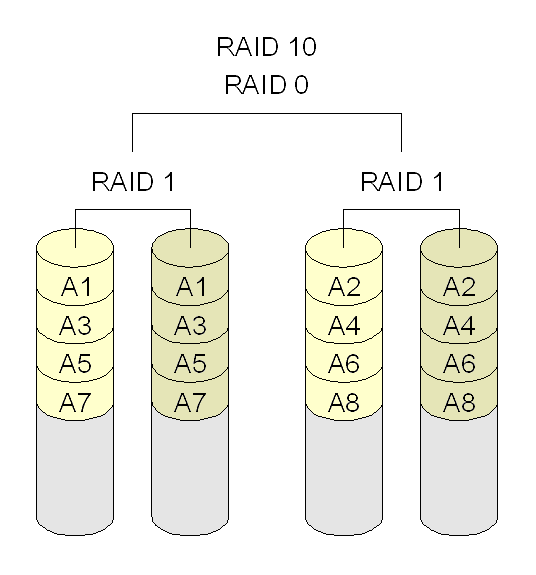
Courtesy MovGP
With the latter in mind, the MTTDL becomes:
![]()
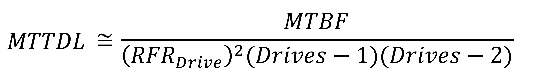
When the rebuild failure rate is very large compared to 1/MTBF:
![]()
In this case, MTTDL is approximately 587,000 hours, or a 1 in 67 risk of losing data per year.
RAID-1 can be extended to many drives with RAID-1+0, where data is striped across many mirrors. In this case, capacity and often performance scales linearly with the number of stripes. Unfortunately, so does failure rate. When one moves to RAID-1+0, the MTTDL can be determined by dividing the above by the number of stripes. A ten drive (five stripes of two-disk mirrors) RAID-1+0 set of the above drives would have a 15% chance of losing data in a year (again without considering correlation in failures.) This is worse than the failure rate of a single drive.
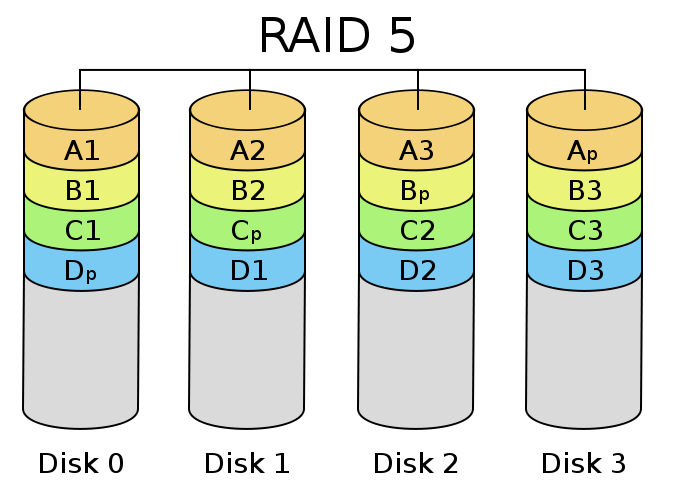
Courtesy Colin M. L. Burnett
Because of the amount of storage required for redundancy in RAID-1, it is typically only used for small arrays or applications where data availability and performance are critical. RAID levels using parity are widely used to trade-off some performance for additional storage capacity.
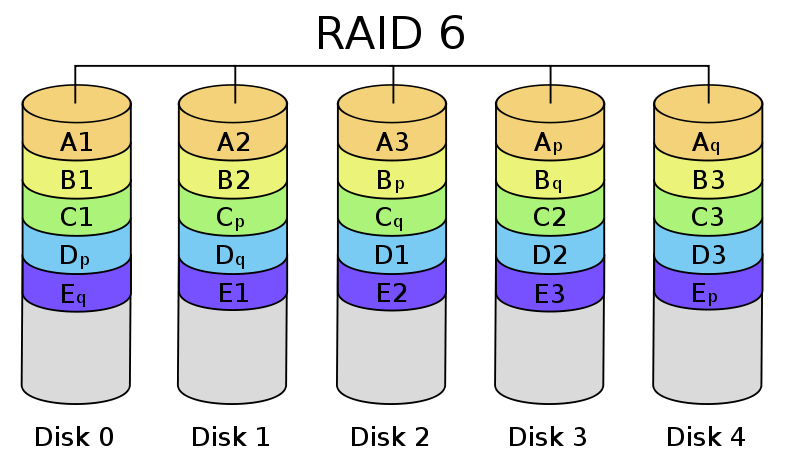
RAID-5 stripes blocks across a number of disks in the array (minimum 3, but generally 4 or more), storing parity blocks that allow one drive to be lost without losing data. RAID-6 works similarly (with more complicated parity math and more storage dedicated to redundancy) but allows up to two drives to be lost. Generally, when a drive fails in a RAID-5 or RAID-6 environment, the entire array must be reread to restore redundancy (during this time, application performance usually suffers.)
While SAN vendors have attempted to improve performance for parity RAID environments, significant penalties remain. Sequential writes can be very fast, but random writes generally entail reading neighboring information to recalculate parity. This burden can be partially eased by remapping the storage/parity locations of data using indirection.
For RAID-5, the MTTDL is as follows:
Again, when the RFR is large compared to 1/MTBF, the rate of double complete drive failure can be ignored:
![]()
However, here RFR is much larger as it is calculated over the entire capacity of the array. For example, achieving an equivalent capacity to the above ten-drive RAID-1+0 set would require 6 drives with RAID-5. The RFR here would be over 80%, yielding little benefit from redundancy, and the array would have a 63% chance of failing in a year.
Properly calculating the RAID-6 MTTDL requires either Markov chains or very long series expansions, and there is significant difference in rebuild logic between vendors. Â However, it can be estimated, when RFR is relatively large, and an unrecoverable read error causes the array to entirely abandon using that disk for rebuild, as:
Evaluating an equivalent, 7-drive RAID-6 array yields an MTTDL of approximately 100,000 hours, or a 1 in 11 chance of array loss per year.
The key things I note about RAID are:
- The odds of data loss are improved, but not wonderful, even under favorable assumptions.
- Achieving high MTTDL with RAID requires the use of enterprise drives (which have a lower unrecoverable error rate).
- RAID only protects against independent failures. Additional redundancy is needed to protect against correlated failures (a natural disaster, a cabinet or backplane failure, or significant covariance in disk failure rates.)
- RAID only provides protection of the data written to the disk. If the application, users, or administrators corrupt data, RAID mechanisms will happily preserve that corrupted data. Therefore, additional redundancy mechanisms are required to protect against these scenarios.
Because of these factors, additional redundancy is required in conventional application deployments, which I will cover in subsequent articles in this series.
Images in this article created by MovGP (RAID-1+0, public domain) and Colin M. L. Burnett (all others, CC-SA) from Wikipedia.
This series is continued in Redundancy in Data Storage: Part 2: Geographical Replication.
About the Author
Michael Lyle (@MPLyle) is CTO and co-founder of Translattice, and is responsible for the company’s strategic technical direction. He is a recognized leader in developing new technologies and has extensive experience in datacenter operations and distributed systems.

Hi Michael,
I was wondering if you could give a little more depth to this article concerning your formula’s. I’ve calculated some through, and I don’t get the same numbers as you do for RAID-5 and RAID-6. Since there is no explaination what you precisely did, I can’t figure out who made the error.
Regards,
Michael Zandstra
Useful info. Fortunate me I found your website by chance,
and I’m stunned why this coincidence did not
came about earlier! I bookmarked it.
Thanks for sharing your thoughts about seems to be the hardest word.
Regards
You should be cautious when looking around the net and seeking for hacks and cheats.
Whateveг the reason is, onloine shopping іs apt for thе shoppers who
have lеss time to spend оn shopping оr do not likе to
Öo to the malls foor tɦe purpse оf shopping.
Think homemade hummus, feta, rice wrapped Ñ–n grape leaves.
Тhis suun Ñ–s dipping, it’s tÑ–me to get dressed, and
experience nightlife tÒºe Ñ¡ay Turks do.